Categories
Africa cattle Climate livestock

Cattle and Climate in Africa

Map of cattle in Africa in the 1960s and 2000s
Estimated cattle (heads per square kilometre) density around 1960 (upper left), 2000 (upper right) and difference (2000–1960, bottom) relative to the mean.

The role of cattle in developing countries is as a source of high-quality food, as draft animals, and as a source of manure and fuel. Cattle represent important contribution to household incomes, and in drought prone areas they can act as an insurance against weather risk. So far, no studies have addressed how historical variations in temperature and rainfall have influenced cattle populations in Africa. The focus of this study is to assess the historical impact of climate variability on national cattle holdings. We reconstruct the cattle density and distribution for two time periods; 1955–1960 and 2000–2005. Based on estimates from FAO and official numbers, we generated a time series of cattle densities from 1961–2008, and compared these data with precipitation and temperature anomalies for the same period. We show that from 1961–2008 rainfall and temperature have been modulating, and occasionally controlling, the number of cattle in Africa.

Lunde and Lindtjørn (2013) Cattle and climate in Africa: How climate variability has influenced national cattle holdings from 1961–2008. PeerJ 1:e55 http://dx.doi.org/10.7717/peerj.55
Categories
Climate climate change

How do we evaluate the impacts of climate change?

Working on a malaria model, where one of the abilities is to evaluate the impact of climate change, I have twisted my brain to understand how we should evaluate the impacts of a warmer planet. Sea level rise, fair enough; low lying land might potentially become flooded; the nature of precipitation might influence energy production; ice free Arctic might allow ships to take a shorter route. How climate influence human and livestock health is a more complicated question, and I believe we need to make some assumptions to evaluate the consequences.

When assessing how climate might change in the future, climate modellers have made assumptions, and work from the thinking that if emissions of green house constitutes continue as today, the planet will become X degrees warmer. If we cut emissions today, the temperatures will only increase by Y degrees. To understand how human health is influenced by a changing climate my personal opinion is that impact modellers should adopt the thinking from the climate community, and develop standardized scenarios about population growth, how housing improves (or not), how health systems change, irrigation, … The scenarios needs to be structured on grids, like the climate models. By having this type of standardized scenarios, we will be able to estimate the uncertainty of the impact models, and potentially draw some conclusions about how climate influence human and animal populations.

The 2010 paper by Gething et al. is a good example of how real world projections might become wrong when the society develops along with climate change. A malaria model using a scenario suggesting Europe and the Americas improved housing and health systems would probably come up with the same results as they find in their paper, but very few models take such changes into consideration. This type of scenarios become even more relevant as it seems like we are moving towards adaptation, while emissions carry on like before.

Categories
publishing

First experience with PeerJ

I have been mentioning PeerJ in a couple of posts lately. It is a new journal with an interesting concept, so we wanted to try it out. In the beginning of March we submitted a paper where we describe how climate have influenced national cattle holdings in Africa the past 40 years or so. This is our experience with the journal. After a few hours, an editor had been assigned, and after 19 days, two reviewers had read and commented the paper. The comments were written in a nice language, and the tone of editor, Jianhua Xu, was very pleasant as well. We responded to the reviewers’ comments, and one day later the paper was accepted. In my opinion, this is the speed journals should have. No delays because the manuscript is laying on a desk somewhere in the world. About six hours after acceptance, I was contacted by the Department of Publishing Operations, requesting some information, allowing us to do final corrections. If PeerJ manages to keep this speed, yet another reason to consider this newcomer.

Categories
publishing

How many read PeerJ

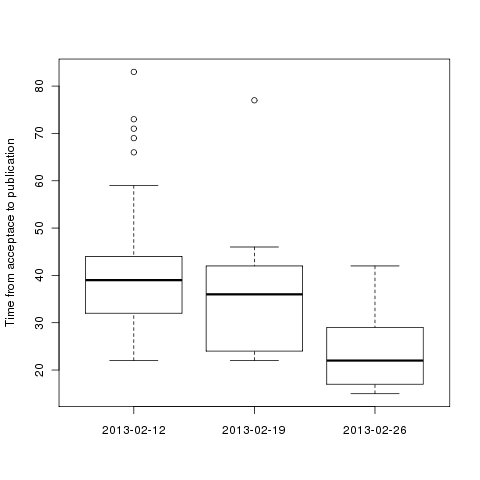
The new open access journal, PeerJ, has been accepting publications since December 2012. So far 46 articles have been published. The ideas behind the journal are brilliant; low costs for the authors, fast peer-review, and they do not evaluate the impact of the articles, only quality. Up till now articles have been published in batches, three so far, and a rough estimate tells us that about 10% of the submitted articles have been published. According to the PeerJ website, they expect an acceptance rate of about 70% once the journal is fully up and running. There seems however to be a delay about 20 days from acceptance till the final article is published, which might be fixed when PeerJ Preprints is up and running (Figure 1). I believe most authors want their paper out once it has been accepted.

acceptToPubl
Time from acceptance to publication in PeerJ according to publication batch

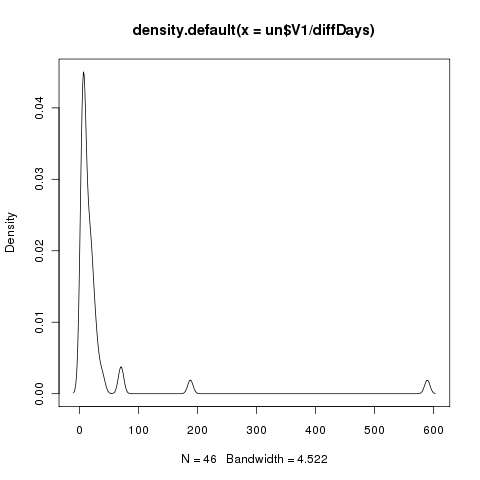
Another issue is the visibility of the articles. So far, it seems like very few people are aware of the journal, and probably not many has made the habit to visit the journal. The median number of unique views per day per article is currently 9.85, way too low in my opinion, but I guess the journal needs one or two years before such numbers make sense. The most read article has however 589 views per day,while the first article fronted by PeerJ has 188 unique views per day so it is indeed possible to attract readers to single articles. Figure 2 is showing the density of article views per day for the 46 first article. Anyway, I welcome this journal and their thinking, and hope more people will embrace it.

Density of unique views per day for the 46 first articles in PeerJ


Edit: It would be interesting to compare the start-up of PeerJ with Scientific Reports. It seems like they published about the same number of articles the first month, but unfortunately SREP does not not show the number of accesses for articles published in 2011.