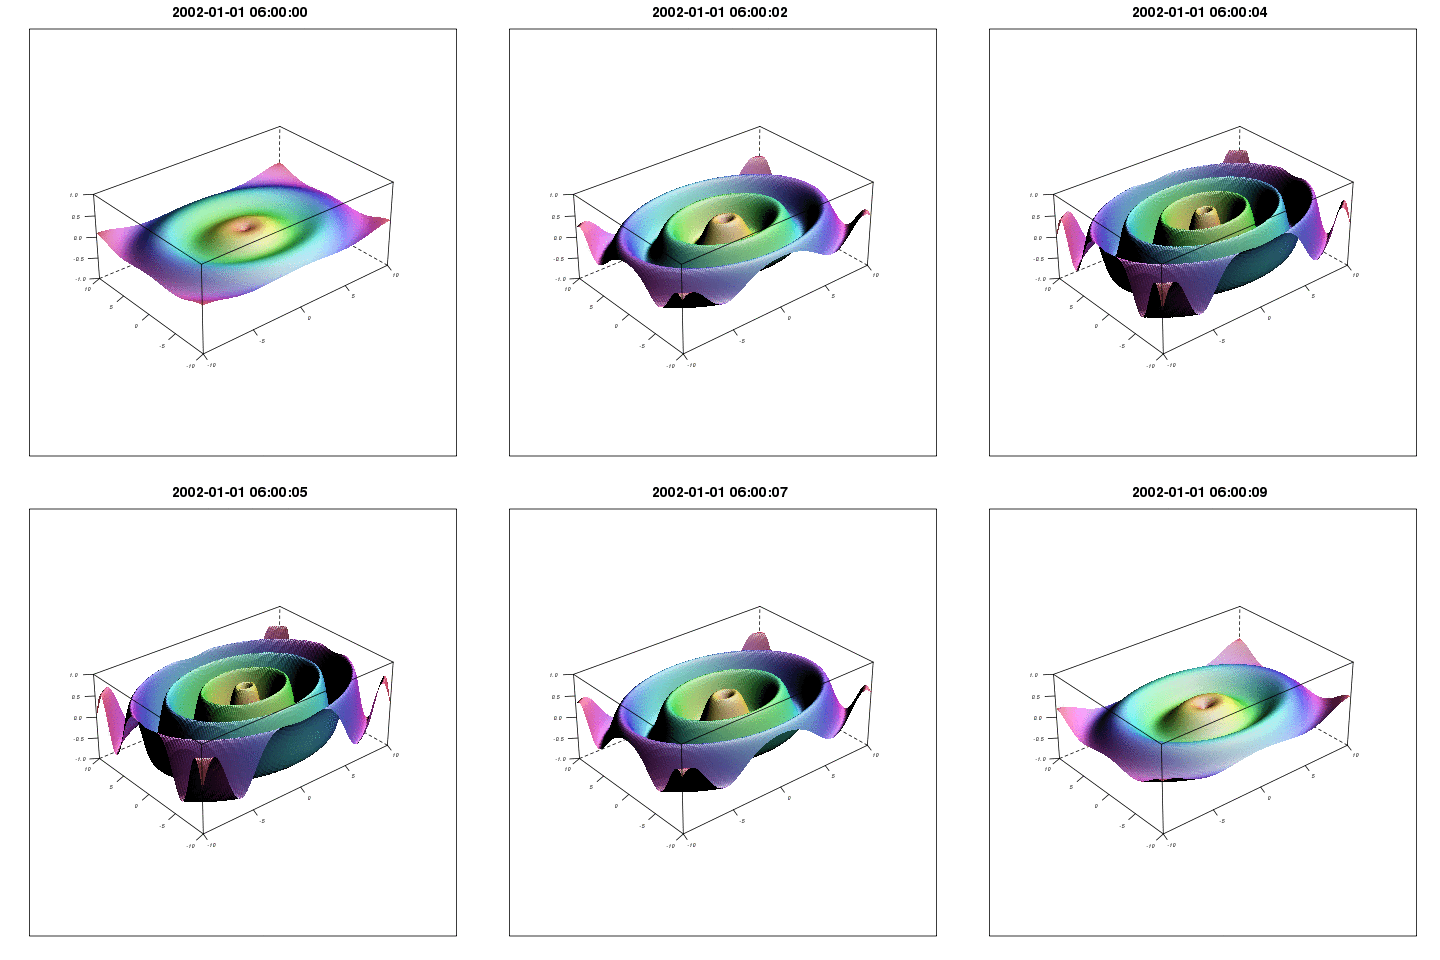
In order to work with netcdf-data and at the same time use sp-methods in R it is convenient to have a spatial format that supports time. A new R format, Spatial3dArray might be one way to deal with these kind of data. To use the new class you have to load sp.
setClass( "Spatial3dArray",
          representation("Spatial", data = "array", coords = "list",
                          time = "character", btime = "character"),
          prototype= list(data = array(NA, c(1,1,1,1)),
                          bbox=matrix(NA),
                          proj4string = CRS(as.character(NA)),
                          coords = list(1,1),
                          time = "posix",
                          btime = "posix"))
An example on a new Spatial3dArray can be:
x <- matrix(seq(-10, 10, length = 150), 150, 150,
            byrow = FALSE)
y <- matrix(seq(-10, 10, length = 150), 150, 150,
            byrow = TRUE)

tm <- 1:10
tm.c <- as.character(seq(as.POSIXct("2002-01-01 06:00:00",
                                    "2002-01-01 15:00:00"),
                          by=1,
                          length.out=10))

z <- array(NA, c(dim(x)[1], dim(x)[2], length(tm.c), 1))

for (i in 1:10) {
a <- c(seq(1,6), rev(seq(2,5)))[i]
b <- c(seq(1, 2, length.out = 5), rev(seq(1, 2, length.out = 5)))
z[,,i,] <- a/10 * ( sin(sqrt((x*b[i])^2+(y*b[i])^2)))
}

sin3dA <- new("Spatial3dArray",
      data = z,
      coords = list(x, y),
      bbox = matrix(c(min(x), min(y), max(x), max(y), 2, 2), 2, 2,
      dimnames = list(NULL, c("min","max"))),
      time = tm.c,
      btime = c(min(tm.c), max(tm.c)))

dimnames(slot(sin3dA, "data")) = list(NULL,
                                      NULL,
                                      slot(sin3dA, "time"),
                                      c("a"))
names(slot(sin3dA, "coords")) <- c("x", "y")
Now usual spatial methods can be used to retrieve bbox and proj4string. Since Spatial3dArray stores coordinates in a different way then the usual sp-objects we have to define a new function to get the coordinates (a list with two matrices):
coordinates.3dArray <- function (obj, type = "list") {
  if (is(obj, "Spatial3dArray")) {
  lat <- slot(obj, "coords")[[1]]
  long <- slot(obj, "coords")[[2]]
  if (type == "list") {
    return(list(lat=lat, long=long))
    } else if (type == "sp") {
        res <- as.matrix(cbind(c(long), c(lat)))
        dimnames(res) <- list(NULL, c("x1", "x2"))
        return(res)
      }
  }
}
setMethod("coordinates", signature("Spatial3dArray"), coordinates.3dArray)
So plotting with lattice wireframe and Graphics Magic would give something like:
I will come back with more methods related to the Spatial3dArray.
