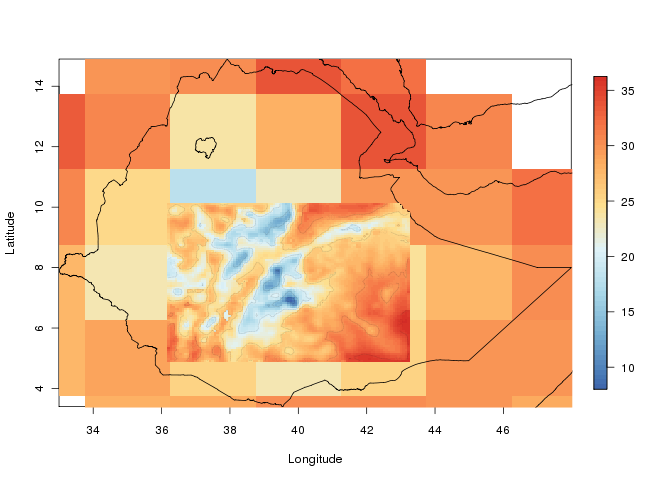
It seems like we are getting the grip on both dynamical downscaling and running things to the supercomputer. At the moment we are running the model for one week (2005 data). Tomorrow morning we expect the computations to finish. Then, once again, it is time to break everything and feed the model with even more data. I guess that is how it works; once you have something that is working, the fun is gone, and you have to make improvements which likely will ruin the setup.
Month: September 2009
OMaWa is a climate driven malaria prediction system. In addition has the ability to be forced with other variables such as preventive measures (bed nets etc). This means that the model might be run for larger areas with only climate data as forcing, or it should be possible to run the model on a smaller scale and make use of information on bed net coverage, house spraying, mosquito resistance to pesticides etc.
So far the modelling system can read “pure” data, such as txt/csv files, NetCDF and partially supports GRIB (linux). In addition it supports ESRI shapefiles, and other GIS formats via helper functions. The GRIB format has been the hardest part to get working, and because of the variety of variants of this format. One thing is to read the data. Another thing is to read it into a standardized format usable for OMaWa (merging several files into one file). GRIB support is not the main focus as NetCDF probably is more common. After the data has been read, it is possible to select the sub-region of interest. The sub region could be an area, or a point. If the spatial resolution on the input parameters is high the point would also be an area to include what is taking place around the point.
In addition the climate parameters has to be converted to meaningful data for the model. OMaWa provides a way to prepare the data to force the model. The work flow would be something like:
- Read data (and convert/interpolate to right projection)
- Select time
- Select a region/point
- Calculate parameters/prepare data
- Set starting values (could be calculated)
- Run the model
To summarize; there are many functions that has to written to complete the steps to run the model. At the moment it is possible follow the steps above. Still there remain a lot of work to document, and streamline the work flow.
Starting to downscale climate data
This autumn part of the EMaPS team are gathered at the Geophysical Institute/University of Bergen to, among other things, focus on down-scaling of climate data. We are now starting to dynamically downscale climate data for a longer period. Since this is computationally heavy we will be using the Cray XT4 system at Parallab. Up till now we have been climbing the steep learning curve, but once we got there the results are coming. The image is showing down-scaled temperature at 2 meters, and is from one of the test runs. The larger cells show the input data.
